
![[Prestashop theme] How to change Color of Address Bar in Mobile Browser for a Prestashop theme?](https://buy-addons.com/blog/wp-content/uploads/2019/05/change-address-bar-120x120.png)
Mobile marketing statistics compilation
Statistics on consumer mobile usage and adoption to inform your mobile marketing strategy mobile site design and app development
“Mobile to overtake fixed Internet access by 2014” was the huge headline summarizing the bold prediction from 2008 by Mary Meeker, an analyst at Kleiner Perkins Caufield Byers who reviews technology trends annually in May. Eric Schmidt of Google exhorted businesses to take a ‘Mobile First’ approach to designing web experiences.
Today, according to the latest Digital Future in Focus report from comScore, we’re long past this tipping point in some countries with India, Mexico and Indonesia having more than up to four times higher smartphone vs desktop audience.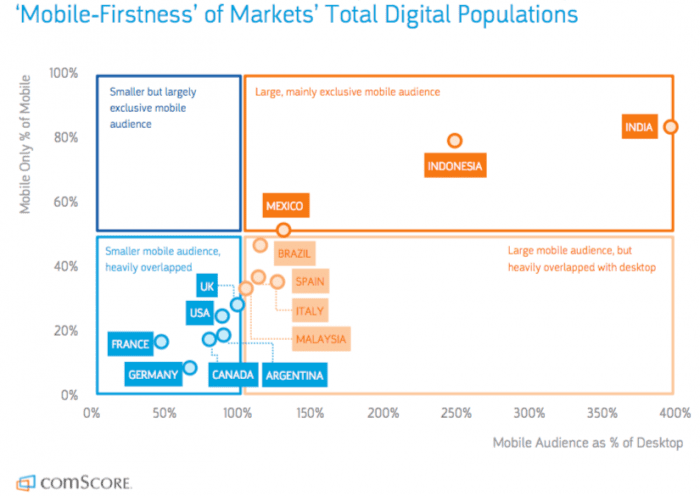
The mobile statistics that the team at Smart Insights curate in the regular updates to this article are grouped under these headings for key questions marketers need to answer about mobile to help them compete:
- Q1. Time spent using mobile media
- Q2. Percentage of consumers using mobile devices
- Q3. How many website visits are on mobile vs desktop devices?
- Q4. Mobile conversion rates vs desktop and visit share for e-commerce sites?
- Q5. Mobile app vs mobile site usage?
- Q6. How important are mobile ads?
- Q7. What percentage of Google Searches are on mobile?
Do you know how to plan a digital strategy? Our RACE planning system explains how to integrate smartphone use into the customer lifecycle. Download our free template today!
Countries covered in this compilation?
The United States and United Kingdom are the main countries covered for which there are many reports. In the Ofcom international benchmark we also cover the main European markets, i.e. France, Germany, Italy, Spain and Sweden. Australia and Japan are also covered.
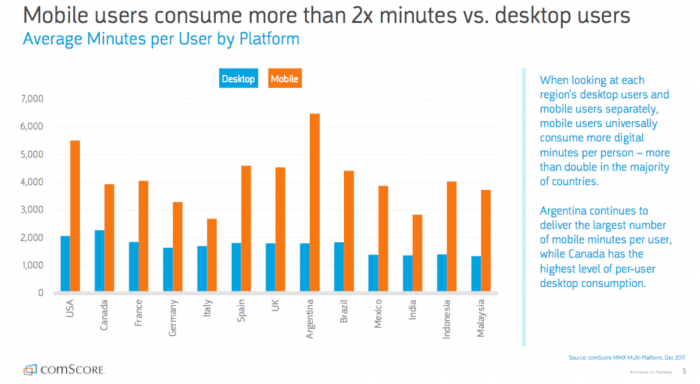
A great source for understanding mobile usage is the Digital Future in Focus report comScore Digital Future in Focus report covering 9 global markets (USA, Canada, UK, Spain, Italy, Brazil, Mexico, China and Indonesia). It clearly shows how mobile dominates in minutes spent across countries.
So that’s the intro showing the importance of mobile, let’s dig into the details to prove it.
Q1. How much time do consumers spend using mobile media?
Mobile media use varies through the day. This is important to understand for dayparting, i.e. buying AdWords and display media. This daypart media use from comScore Global Digital Future in Focus shows how desktop is still important for daytime at work audiences, but Tablet and smartphone dominate in the evening.
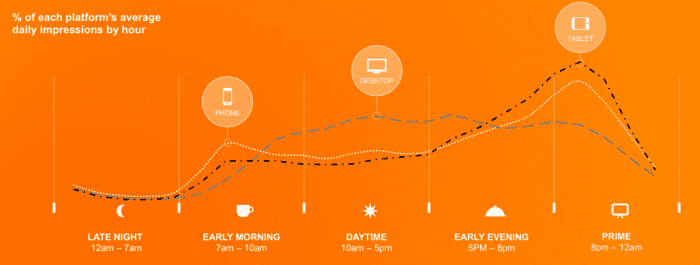
The implications are clear – if you’re not able to reach your audience through mobile search or display, or you’re not providing a satisfactory mobile experience you will miss out compared to competitors who are. Mobile only
Mobile-only social Networks like Snapchat are also growing rapidly in popularity, and this is driving increases in time spent on mobile devices. For more information, see our article on Snapchat marketing statistics.
Q2. Percentage of consumers using mobile devices?
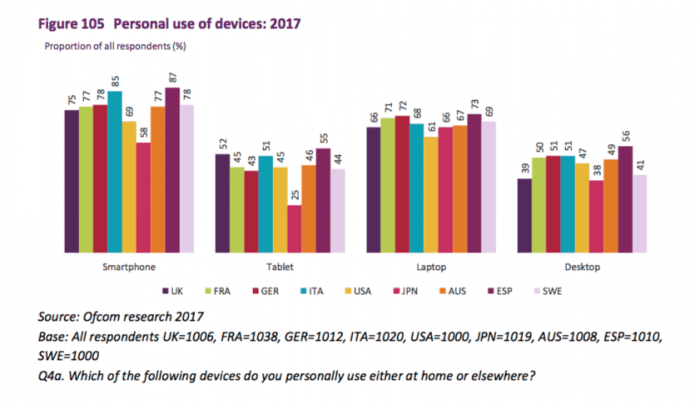
This end 2017 Ofcom international benchmark shows the global popularity of using different digital devices in representative countries.
This interesting visual from comScore also part of their digital future in focus shows the picture that marketers need to build up. This panel data shows that the majority of consumers are multiplatform and will often be multi-screening, accessing sites on mobile or desktop, so consistent experiences across device need to be deployed.
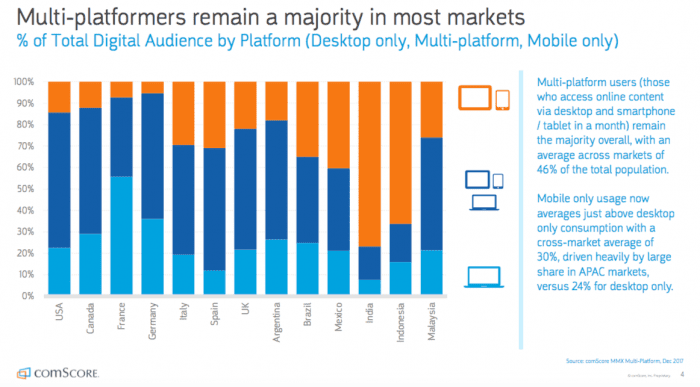
We recommend you understand this multichannel switching behaviour for your own brand. As Rob Thurner explained in his post on KPIs to review m-commerce effectiveness, it’s important to keep track of the split between users of mobile and desktop devices visiting your site(s). Using segments in Google Analytics is the best way to do this.
Q3. How many website visits are on mobile vs desktop devices?
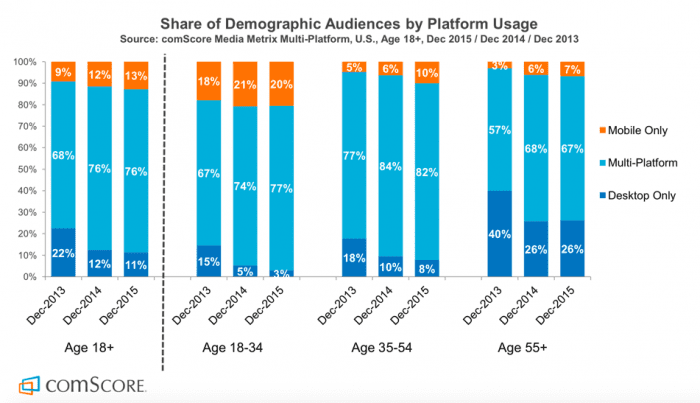
However, we need to be careful with interpreting data on hours spent, since we spend most of our time on smartphones checking email and using social media. This has led to the common mantra of ‘Mobile-First’ design which I think is dangerous, or at least oversimplistic! Eric Schmidt, then Chairman of Google talked about a Mobile-First approach. The reality is that while smartphone use is overwhelmingly popular for some activities such as social media, messaging and catching up with news and gossip, the majority of consumers in western markets also have desktop (and tablet) devices which they tend to use for more detailed review and purchasing. So we need to think about strategies to engage what comScore call the Multichannel Majority not simply ‘mobile first’ or ‘smartphone adoption’. This explains why mobile conversion rates are much lower in retail and why the breakdown between traffic for retail sites is broadly equal between smartphone and desktop. Audience measurement platform comScore has talked for some time about strategies to engage and measure the multiplatform majority across devices and I think there will, or should be more focus on that in the years ahead.
This UK data also shows the importance of the multichannel majority in sectors like Retail and to a lesser extent banking, but that for some niches like weather ‘mobile first’ is more accurate.
Their latest data for the US is striking in shows how the multi-device majority dominate, particularly amongst millennials.
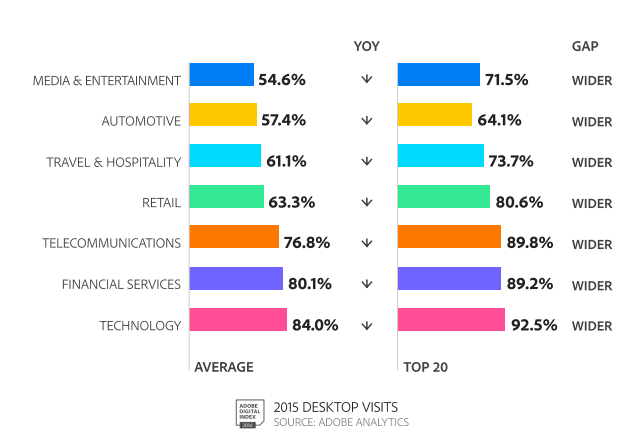
Although mobile is growing in importance, this older data from Adobe’s latest Digital Index (not updated yet) shows that in all industries the majority of visits are still on desktop.
So with so many site visits still on desktop, it’s important when designing using a responsive web design that the desktop experience isn’t degraded and this has led to many larger businesses using an adaptive web design where layout and content are tailored for desktop, tablet and smartphone screen dimensions.
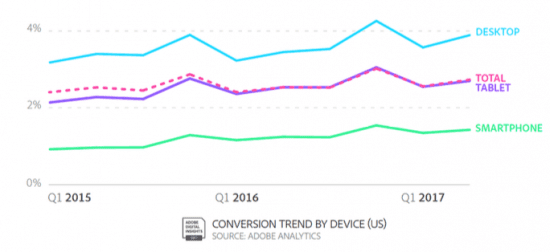
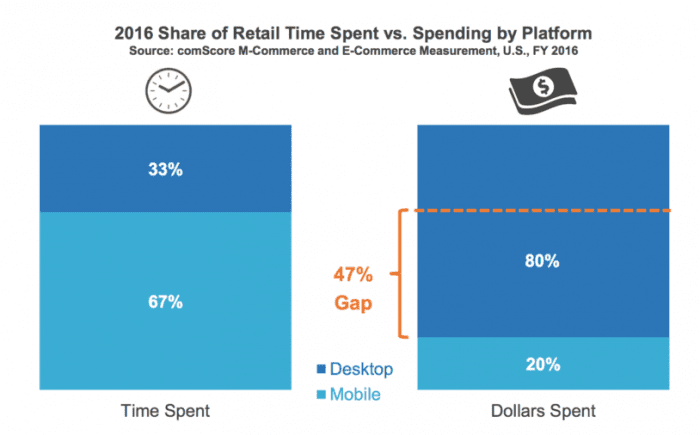
Q4. Mobile device conversion rates and visit share for e-commerce sites?
We have a separate compilation of e-commerce conversion stats if you’re creating a business case for mobile optimised sites as explained in our mobile marketing strategy guide, this data is also valuable since it shows the variation in conversion rate by mobile type. This is the latest data from Monetate for their retail clients showing conversion rates. It shows this rule of thumb:
Smartphone conversion is around one-half of desktop conversion rates.
Their latest quarterly update from 2017 shows conversion rates to add-to-basket or cart and below sale across the last 4 quarters, up to the Q3 2016:
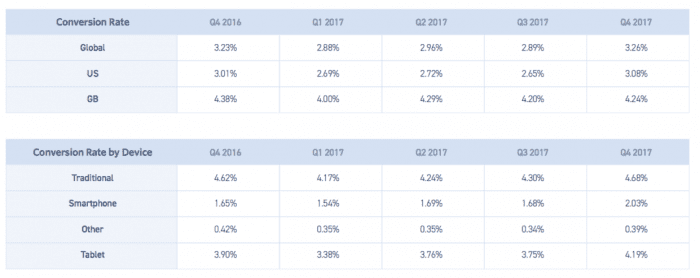
The data clearly shows that Smartphone conversion rates are much lower than for desktop – important if you’re making the business case for a mobile responsive site.
This report from the Adobe Digital Index retail report has a simple table comparing cart and visit (overall) conversion on smartphone vs tablet vs desktop. It shows that visit conversion is nearly 3 times higher on desktop vs smartphone.
 Here are the tabulated figures:
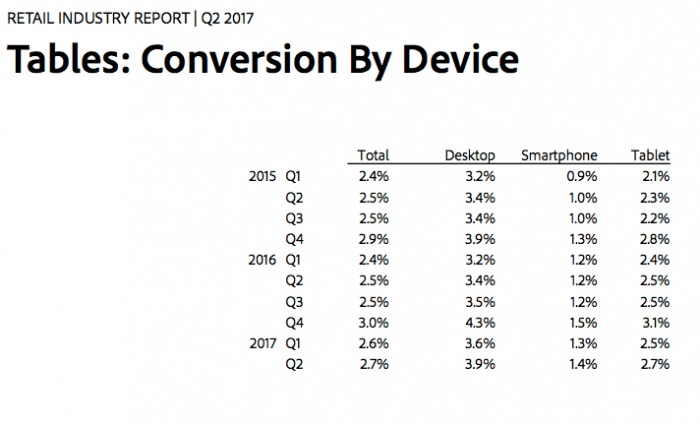
- Location: US Retail
- Date: Published Autumn 2017 (2016 data)
- Sample: Top 250 US retailers (so representative of common consumer behaviour)
- Source: Adobe Retail Industry report
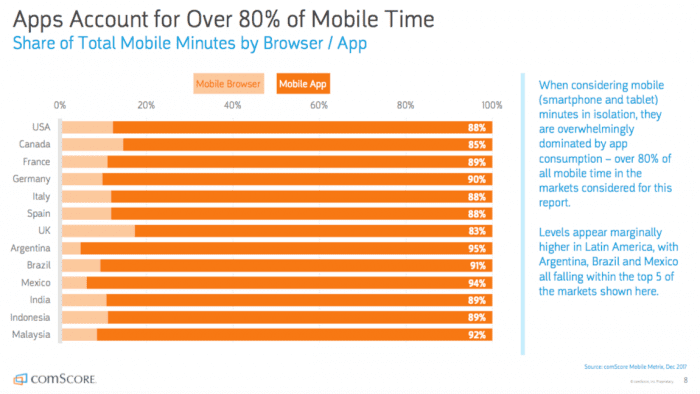
Q5. Mobile media time – app vs mobile site usage? App usage (90% of time) dominates browsers in mobile usage
Consumer preference for mobile apps vs mobile sites should also be thought through as part of mobile strategy.
We have seen at the start of this article that mobile dominates, digital minutes, but where are these mobile minutes happening. In all these countries the percentage of mobile minutes spent on apps is 80-90%:
More than 80% of mobile minutes in all markets are spent in apps.
The latest comScore global mobile report 2018 shows how important apps are across different countries.
Flurry is a great source for details of app usage. Its 2018 State of app usage report shows that mobile app usage is growing 6% Year-on-year and shows the growth of apps in some categories like e-commerce which is useful insight for retailers.
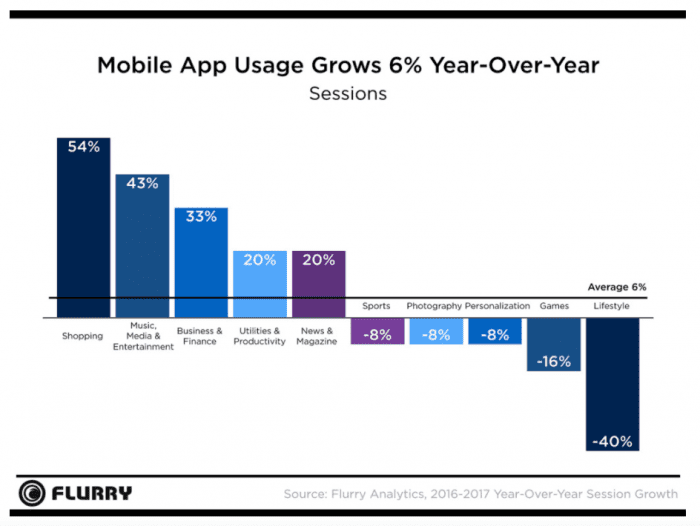
Today, the latest data from Yahoo’s Flurry analytics shows that in the US 90% of consumer’s mobile time is spent in apps. As they put it: It’s an App World. The Web Just Lives in It. This is a key insight as companies decide whether to develop mobile apps or create mobile device specific apps.
This 80%+ figure is a key insight as companies decide whether to develop mobile apps or restrict themselves to mobile optimised sites. You do have to be careful about interpreting this since, as the chart below shows, Facebook, messaging, games and utility apps will naturally have the greatest time spent and browser use is still significant by volume if not proportion. But this has implications for advertising on mobile to reach consumers using apps like Facebook and Gmail.
Q6. Mobile ad spend still lags behind mobile media consumption
So, how have advertisers responded to the change in mobile media time? The next chart from the last full year report from comScore reported on MarketingLand shows that despite the growth in media time above, some advertisers are missing out since the right-most bar shows that there is a huge missing opportunity on mobile advertising
This research sourced from a 2015 study by eMarketer into mobile ad budgets shows a different view. In 2015 mobile ad spending accounts for 49% of digital ad spending, which is only slightly behind the trends of how people are using their devices. These stats also show projections for future growth, which is important as it shows where the market is going. It is clear that mobile is the future, and within 3 years it will come to dominate digital ad spending.
| 2015 | 2016 | 2017 | 2018 | 2019 | |
|---|---|---|---|---|---|
| Mobile Ad spending- Billions $ | 28.7 | 40.5 | 49.8 | 57.7 | 65.8 |
| Percentage change | 50% | 41% | 23% | 16% | 14% |
| Percentage of digital ad spending | 49% | 60.4% | 66.6% | 69.7% | 72.2% |
Q7. How consumers research products using mobile search and review sites
The Hitwise Mobile Search: Topics and Themes reports shows how much mobile search depends on product sector and the category of device: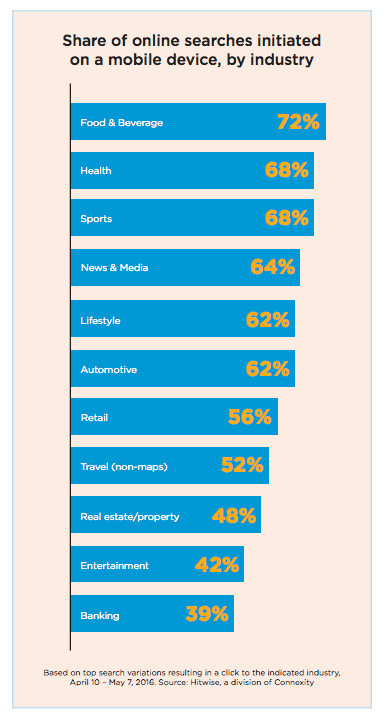
In many categories, including retail and Automotive, it is now above 50%, but some higher involvement purchase decisions such as banking and real estate are lower.
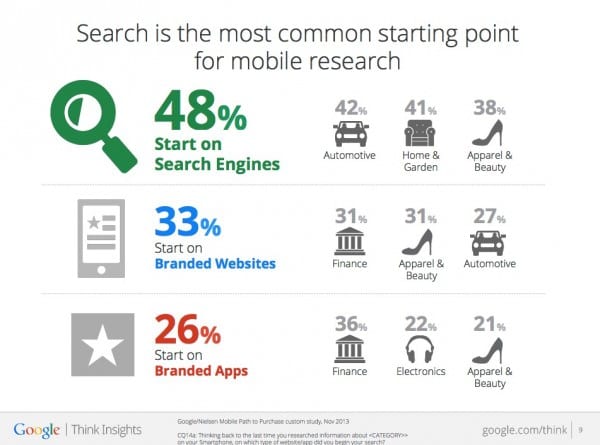
Google’s mobile path to purchase report surveyed 950 US consumers across 9 different verticals (Restaurants, Food & Cooking, Finance, Travel, Home & Garden, Apparel & Beauty, Automotive, Electronics, Health & Nutrition) to assess how they researched purchases via mobile. A key finding is the starting point for mobile research. As might be expected search was the most common starting point, but it’s lower than desktop showing the importance of branded apps and mobile sites.
The 5 best sources for reviewing mobile marketing statistics in 2018?
This update to this post features some of the latest updates on mobile statistics and we will continue to update them through the year. But more recent data can be sourced. To conclude we highlight some of the best sources to make the business case for investment in mobile marketing in your presentations and business cases to colleagues or clients.
- Google Consumer Barometer. A regular survey for different countries starting in 2011, this enabled you to prepare your own reports. Google’s Consumer barometer enables you to create similar reports.
- ITU. The International Telecoms Union data reports mobile usage including mobile broadband subscriptions to show growth in use of mobile. This reported at country, continent and overall levels, so is the best overall source for mobile penetration worldwide. Much of the information is free – see their free mobile statistics section.
- Flurry Mobile Analytics. This is a great source for showing the overall level of app usage across the four major mobile app platforms by country and drilling down into the popularity of individual apps for different sectors like retail, banking and travel. For example, the latest mobile app growth figures from Flurry show growth of category use by more than 50% in many categories.
- Comscore Digital Future Series. Comscore is one of the key worldwide sources useful for marketers to help us find out about the changes in use of mobile media by consumers. You will see we have referenced this a lot. This graph shows the pattern across Europe – follow the link above for US and other country breakdowns.
- Ofcom Internet usage report. Ofcom’s most recent International Communications Market Report was published last December, this examines take-up, availability, price and use of broadband, landlines, mobiles, TV, radio and post across 17 major countries.
We hope this compilation of statistics about mobile usage and effectiveness continues to be useful – please share if it is and we’ll continue to update it in 2017.
If you want a single source of the latest stats across the whole of digital marketing, for Expert members, we compile a regularly updated set of usage statistics to use in presentations – it’s updated each quarter so all the latest stats are categorised in a single place for including in presentations. Our Free member resources also include templates and guides to help create digital strategy and plans.
International mobile use in Europe
This Nielsen Online media usage research report covers audience use (and for the UK)
France mobile vs desktop usage
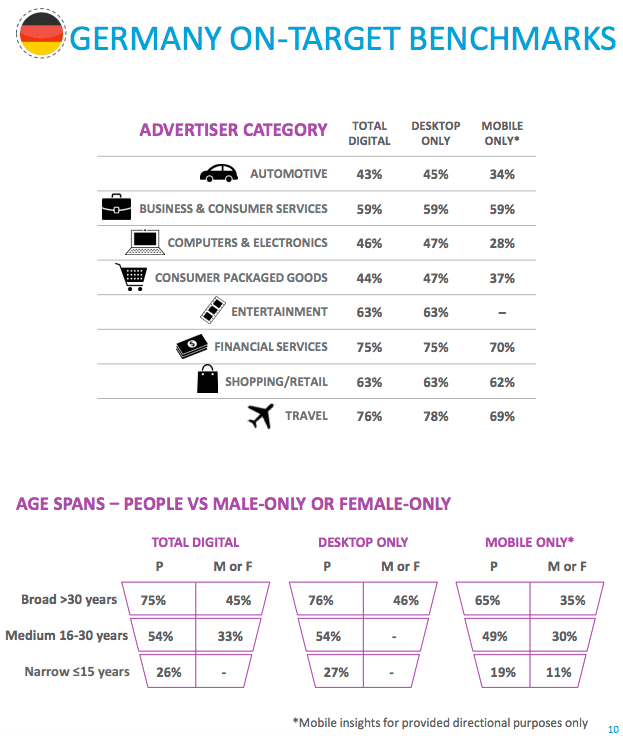
Germany mobile vs desktop usage
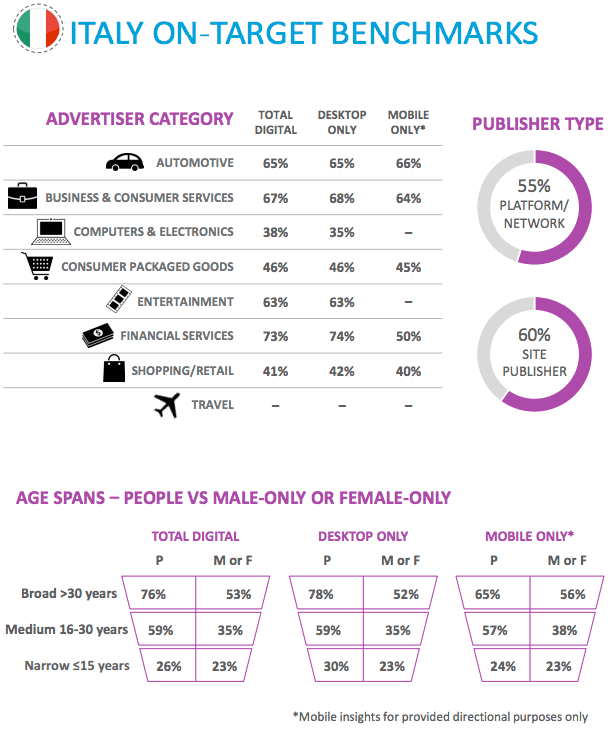
Italy
Source: https://www.smartinsights.com/mobile-marketing/mobile-marketing-analytics/mobile-marketing-statistics/
Related Articles
Leave a reply
You must be logged in to post a comment.
-

10 Proven Techniques to Increase Your Store’s Average Order Value
You’ve started your eCommerce store, and you are marketing it. You’ve finally started selling a few products, but most of…
-

A list of PrestaShop modules to consider for a successful Black Friday and Holiday season
In addition to holiday sales, the Black Friday phenomenon, about a month before Christmas, continues to grow each year. For…